Bandwidth, Noice

Bandwidth of signal
The voice signal, which is the most common message in telecommunication networks, is not similar to a pure sine wave. It contains many sine waves with different frequencies and amplitudes combined together. The range of frequencies that is needed for good enough quality voice, so that the speaker can be recognized, was defined to be ranged from 300 Hz to 3400 Hz.

Keywords
- Bandwidth
- Quality of bandwidth
- Transfer of images and files
- Multi -users
- Network capacity
- Multi -Tasking
- Network performance
- Online Business
- Noise
- Signal Noice Power Ratio
- SNR measurement
- Classification of Noise
- Natural noise
- Distortions
- Signal + noice to ratio
- Noise Figure
- Components of Noise
Bandwidth
SNR measurement
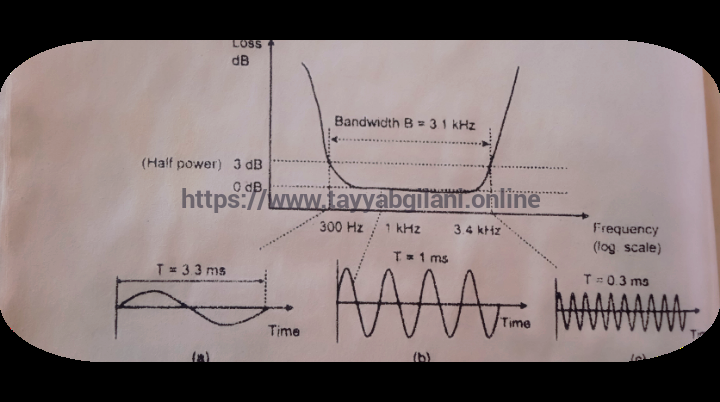
The voice signal, which is the most common message in telecommunication networks, is not similar to a pure sine wave. It contains many sine waves with different frequencies and amplitudes combined together. The range of frequencies that is needed for good enough quality voice, so that the speaker can be recognized, was defined to be ranged from 300 Hz to 3400 Hz. This means that the bandwidth of the telephone channel through the network is 3400 Hz – 300 Hz, = 3.1 kHz. A human voice contains much higher frequencies, but this bandwidth was defined as a compromise between quality and cost. It is wide enough to recognize the speaker.
Bandwidth is not strictly limited in practice, but signal attenuation increased heavily at the lower and upper cut-off frequencies, 300 Hz and 3.1 Hz, of the voice band. The bandwidth is normally measured from the point where the signal power is dropped to half from its maximum power. Attenuation or loss of channel is given as a logarithmic measure called the decibel (dB) and half power point corresponds to α 3 dB loss.
Bandwidth of the telephone’s speed channel, the attenuation or loss of 3 dB, decreases power to half and causes a corresponding voltage drop from 1 to 0.707 sine wave, oscillating.
(a) 300 times attenuation to half power.
(b) 1000 times/s does not attenuate at all, and,
(c) 3400 times/s attenuation to half power.
To describe the importance of bandwidth in the telecommunications system, we have to understand different aspects of it.
The main meaning of data transfer speed is that it shows this frequency range. On which data can be transmitted. The more bandwidth, the more data can be transmitted at a time. Examples: If you are streaming video on the Internet, more bandwidth means that video can be seen in high quality, without buffering.
Quality bandwidth amounts to determine how the data quality will be.
Sound and video transmission
When you make phone calls or video conferencing, the sound is cleaned and the video is smooth due to the bandwidth.
Transfer of images and files
Large files can be moved faster if bandwidth is high.
Multi -users
Bandwidth can be divided between several users.
Network capacity
If bandwidth is high, more people can use the Internet at the same time without any slowdown.
Multi -Tasking
Different applications can be used at the same time. Such as video streaming, online gaming, and file downloading etc.
Network performance
The bandwidth network also affects the overall performance.
– load management
More bandwidth network has the ability to bear more loads.
Packet Log and letter deficiency
If the bandwidth is high, the delay of data packets and the letter is low. Thanks to the network performance improves.
Business importance becomes even more important in the business world.
Online Business
E -commerce websites and online services require more bandwidth.
Noise
In the communication sense, noise is the best described as a phenomenon that destroys information. In the electric sense, it is represented signals of any form that are unwanted, including signal from random variation of electrical change from all sources, interference from signal that are required by other user, and even distortion to the wanted signals. The presence of such noise is therefore often the limited factor in signal detection, and this gives rise to the term Signal to Noise Power Ratio, (S/N Ratio), which defined a system sensitive to noise. Noise and interference are different in nature. Noise appears as randomly varying voltages that are not related in either phase or frequency. By comparison, interference tends to be periodic and regular.
Signal Noice Power Ratio
Signal Noice Power Ratio or SNR is an important scale that is used to measure a signal standard. This rash also determines this. The extent to which the power of the actual information (signal) in a signal is higher than the noise (noise)
SNR measurement
Signal Noice Ratio is usually measured in the DC Bill (DB). To measure the SNR in the DC Bill, the following formula uses: [ Text {SNR (DB)} = 10 Log_ {10} LEFT ( FRAC {P _ {SIGNAL}}}} {P_ { Text {noise}}} right)]
Importance of Signal Noice power Ratio
By measurement, we know what the signal condition is in a system. More SNR means that signal quality is good, while low SNR means that the signal is high, which damages the quality of the signal.
Examples of the Telecommunication
Better SNR in mobile phone calls and Internet data transmission Without a clear conversation or high -speed internet is not possible. Audio recording: Better SNR in recording means that recorded sound is less noise, which improves sound quality.ll
Video Quality
Video Signals Better SNR means That the picture will be more clear and less noisy. Ways to improve SNR
Filtering
Eliminate unnecessary noise through filters.
Implant Fires
Use of implant fires to enhance signal strength – better circuit design
Use of elements in the circuit that produce minimal noise
Signal Noice Ratio is a basic measure to understand and improve the quality of the signal. The improvement of SNR in different fields can not only increase the quality of the signal but also improve the performance of the system.
Classification of Noise
For technological reasons, noise is often divided into two classes.
Artificial or man-made noise, such as interference, tends to be impulsive and is mainly due to electrical machines and -eracing or sparking contacts. The interference is regular in nature and can usually be suppressed at source using appropriate filters.
Natural noise
This form of noise is chiefly due to inversion by prevalent electromagnetic radiation and the noise generated by various circuit components due to thermal agitation of modules.
Distortions
The information carried by an analog signal is contained with the signals instantaneous amplitude, frequency, and phase. Any phenomenon that disturbs this relationship destroys the waveform and reduces the intelligibility of the signal. Since this is an unwanted feature of the signal processing, distortion has a noise-like effect. This effect can be qualified either by measurement or analysis, and can be expressed as a kind of signal-to-noise ratio.
Signal + noice to ratio
This is often used to describe the sensitivity of a receiver system. It is expected that the maximum input signal level necessary to produce a given output level for a certain value of signal to noise ratio at a specified degree of sensitivity.
Noise Figure
In general, system performance can be characterized by three closely liked parameters:
overall gain, bandwidth, and noice figure.
System gain is particularly unlimited, but the usable level of gain is set by the bandwidth and the level of noise that can be accepted before it swamps the modulation or generates too many digital errors. Thus, these three parameters should always be specified in a related manner. The noise factor or figure {F} described how the noise generated within the system, due to amplification and processing, adds to the thermally generated noice already present at the input and further degrades the signal to noice power ratio [S/N].
The noice factor (F) is thus the ratio and quoted either as a ratio or in dB.
The total noise at the output of a system (No) includes contributions from both the thermal noise at the input, amplified by the system gain (G).
It is internally generated noise within the system itself (Ni).
Here’s a more detailed explanation:
Noise Figure Formula (NF) is given below
The noise factor is show (F).
And
The noise figure (NF) can be expressed in terms of the input and output signal to the noise ratios
(S/N).
Total Noise at the Output (No)
The total noise output (No) of a system is the sum of the amplified input noise and the internally generated noise
[ N_o = G cdot N_i + N_{text{internal}} ]Where:( N_o ) is the total noise at the output.( G ) is the system gain.( N_i ) is the thermal noise at the input.( N_{text{internal}} ) is the noise generated internally by the system.
Components of Noise
Thermal Noise at the Input (N_i)
This is the inherent noise present due to the thermal agitation of electrons in the input circuitry.It can be calculated using the formula:
( N_i = kTB ),
where:
( k ) is Boltzmann’s constant (1.38 × 10⁻²³ J/K).
( T ) is the absolute temperature in Kelvin.
( B ) is the bandwidth in Hz.
Amplified Input Noise:
When the input signal, including the thermal noise, is amplified by the system gain ( G ), the noise at the output due to this component is ( G cdot N_i ).
